Tractography Clustering with QuickBundles
This example explains how we can use QuickBundles [Garyfallidis12] to simplify/cluster streamlines.
First import the necessary modules.
import numpy as np
from dipy.io.streamline import load_tractogram
from dipy.tracking.streamline import Streamlines
from dipy.segment.clustering import QuickBundles
from dipy.io.pickles import save_pickle
from dipy.data import get_fnames
from dipy.viz import window, actor
For educational purposes we will try to cluster a small streamline bundle known from neuroanatomy as the fornix.
fname = get_fnames('fornix')
Load fornix streamlines.
fornix = load_tractogram(fname, 'same', bbox_valid_check=False)
streamlines = fornix.streamlines
Perform QuickBundles clustering using the MDF metric and a 10mm distance threshold. Keep in mind that since the MDF metric requires streamlines to have the same number of points, the clustering algorithm will internally use a representation of streamlines that have been automatically downsampled/upsampled so they have only 12 points (To set manually the number of points, see Resample Feature).
qb = QuickBundles(threshold=10.)
clusters = qb.cluster(streamlines)
clusters is a ClusterMap object which contains attributes that provide information about the clustering result.
print("Nb. clusters:", len(clusters))
print("Cluster sizes:", map(len, clusters))
print("Small clusters:", clusters < 10)
print("Streamlines indices of the first cluster:\n", clusters[0].indices)
print("Centroid of the last cluster:\n", clusters[-1].centroid)
Nb. clusters: 4

Cluster sizes: [64, 191, 47, 1]

Small clusters: array([False, False, False, True], dtype=bool)

Streamlines indices of the first cluster:
[0, 7, 8, 10, 11, 12, 13, 14, 15, 18, 26, 30, 33, 35, 41, 65, 66, 85, 100,
 101, 105, 115, 116, 119, 122, 123, 124, 125, 126, 128, 129, 135, 139, 142,
 143, 144, 148, 151, 159, 167, 175, 180, 181, 185, 200, 208, 210, 224, 237,
 246, 249, 251, 256, 267, 270, 280, 284, 293, 296, 297, 299]

Centroid of the last cluster:
array([[  84.83773804,  117.92590332,   77.32278442],
       [  86.10850525,  115.84362793,   81.91885376],
       [  86.40357208,  112.25676727,   85.72930145],
       [  86.48336792,  107.60327911,   88.13782501],
       [  86.23897552,  102.5100708 ,   89.29447174],
       [  85.04563904,   97.46020508,   88.54240417],
       [  82.60240173,   93.14851379,   86.84208679],
       [  78.98937225,   89.57682037,   85.63652039],
       [  74.72344208,   86.60827637,   84.9391861 ],
       [  70.40846252,   85.15874481,   82.4484024 ],
       [  66.74534607,   86.00262451,   78.82582092],
       [  64.02451324,   88.43942261,   75.0697403 ]], dtype=float32)
clusters has also attributes like centroids (cluster representatives), and methods like add, remove, and clear to modify the clustering result.
Lets first show the initial dataset.
# Enables/disables interactive visualization
interactive = False

ren = window.Renderer()
ren.SetBackground(1, 1, 1)
ren.add(actor.streamtube(streamlines, window.colors.white))
window.record(ren, out_path='fornix_initial.png', size=(600, 600))
if interactive:
    window.show(ren)
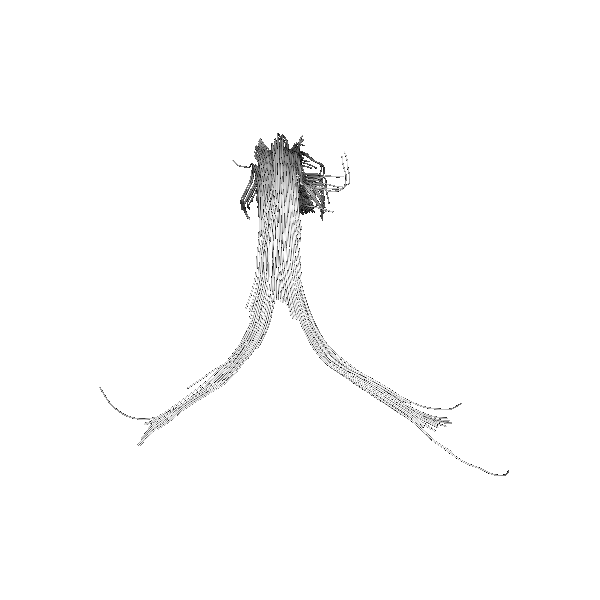
Initial Fornix dataset.
Show the centroids of the fornix after clustering (with random colors):
colormap = actor.create_colormap(np.arange(len(clusters)))

window.clear(ren)
ren.SetBackground(1, 1, 1)
ren.add(actor.streamtube(streamlines, window.colors.white, opacity=0.05))
ren.add(actor.streamtube(clusters.centroids, colormap, linewidth=0.4))
window.record(ren, out_path='fornix_centroids.png', size=(600, 600))
if interactive:
    window.show(ren)
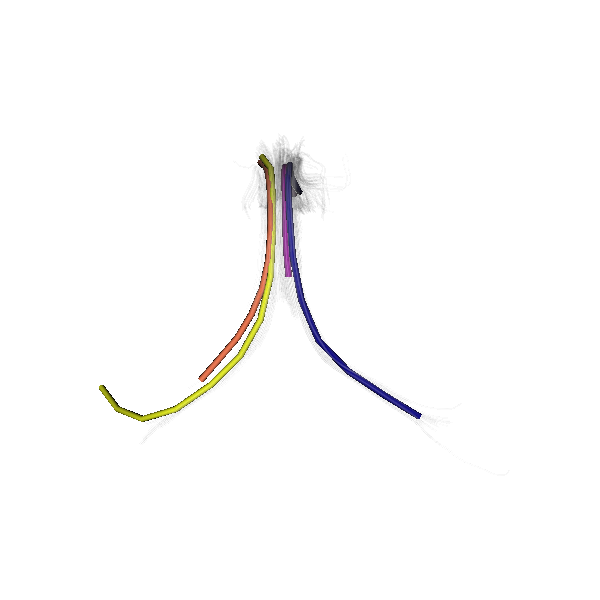
Showing the different QuickBundles centroids with random colors.
Show the labeled fornix (colors from centroids).
colormap_full = np.ones((len(streamlines), 3))
for cluster, color in zip(clusters, colormap):
    colormap_full[cluster.indices] = color

window.clear(ren)
ren.SetBackground(1, 1, 1)
ren.add(actor.streamtube(streamlines, colormap_full))
window.record(ren, out_path='fornix_clusters.png', size=(600, 600))
if interactive:
    window.show(ren)
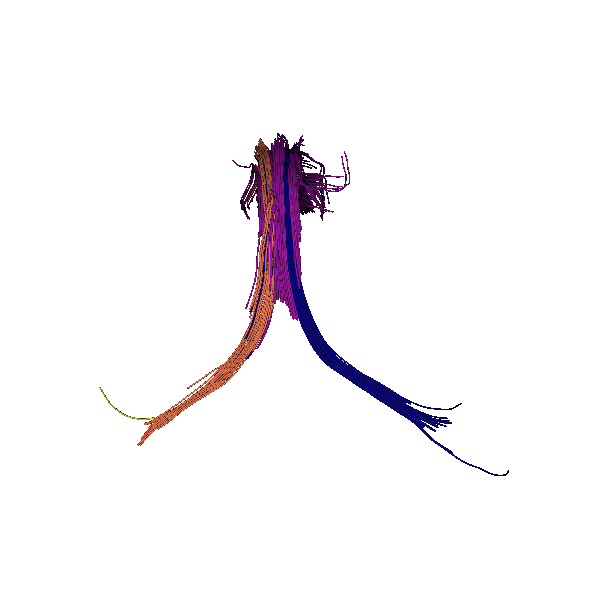
Showing the different clusters.
It is also possible to save the complete ClusterMap object with pickling.
save_pickle('QB.pkl', clusters)
Finally, here is a video of QuickBundles applied on a larger dataset.
References
- Garyfallidis12
Garyfallidis E. et al., QuickBundles a method for tractography simplification, Frontiers in Neuroscience, vol 6, no 175, 2012.
Example source code
You can download the full source code of this example. This same script is also included in the dipy source distribution under the doc/examples/ directory.