Note
Go to the end to download the full example code.
Tractography Clustering with QuickBundles#
This example explains how we can use QuickBundles [1] to simplify/cluster streamlines.
First import the necessary modules.
import numpy as np

from dipy.data import get_fnames
from dipy.io.pickles import save_pickle
from dipy.io.streamline import load_tractogram
from dipy.segment.clustering import QuickBundles
from dipy.viz import actor, colormap, window
For educational purposes we will try to cluster a small streamline bundle known from neuroanatomy as the fornix.
fname = get_fnames(name="fornix")
Load fornix streamlines.
fornix = load_tractogram(fname, "same", bbox_valid_check=False)
streamlines = fornix.streamlines
Perform QuickBundles clustering using the MDF metric and a 10mm distance threshold. Keep in mind that since the MDF metric requires streamlines to have the same number of points, the clustering algorithm will internally use a representation of streamlines that have been automatically downsampled/upsampled so they have only 12 points (To set manually the number of points, see Resample Feature).
qb = QuickBundles(threshold=10.0)
clusters = qb.cluster(streamlines)
clusters is a ClusterMap object which contains attributes that provide information about the clustering result.
Nb. clusters: 4
Cluster sizes: <map object at 0x4967ab370>
Small clusters: [False False False  True]
Streamlines indices of the first cluster:
 [0, 7, 8, 10, 11, 12, 13, 14, 15, 18, 26, 30, 33, 35, 41, 65, 66, 85, 100, 101, 105, 115, 116, 119, 122, 123, 124, 125, 126, 128, 129, 135, 139, 142, 143, 144, 148, 151, 159, 167, 175, 180, 181, 185, 200, 208, 210, 224, 237, 246, 249, 251, 256, 267, 270, 280, 284, 293, 296, 297, 299]
Centroid of the last cluster:
 [[ 84.838 117.926  77.323]
 [ 86.109 115.844  81.919]
 [ 86.404 112.257  85.729]
 [ 86.483 107.603  88.138]
 [ 86.239 102.51   89.294]
 [ 85.046  97.46   88.542]
 [ 82.602  93.149  86.842]
 [ 78.989  89.577  85.637]
 [ 74.723  86.608  84.939]
 [ 70.408  85.159  82.448]
 [ 66.745  86.003  78.826]
 [ 64.025  88.439  75.07 ]]
clusters also has attributes such as centroids (cluster representatives), and methods like add, remove, and clear to modify the clustering result.
Let’s first show the initial dataset.
# Enables/disables interactive visualization
interactive = False

scene = window.Scene()
scene.SetBackground(1, 1, 1)
scene.add(actor.streamtube(streamlines, colors=window.colors.white))
window.record(scene=scene, out_path="fornix_initial.png", size=(600, 600))
if interactive:
    window.show(scene)
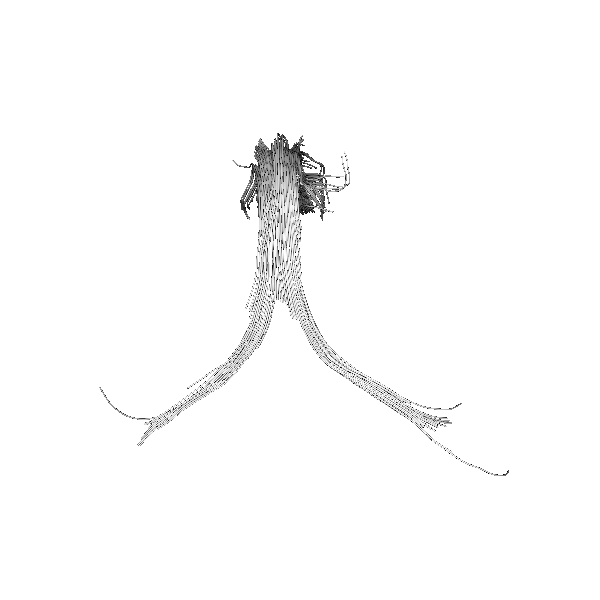
Initial Fornix dataset.
Show the centroids of the fornix after clustering (with random colors):
colormap = colormap.create_colormap(np.arange(len(clusters)))

scene.clear()
scene.SetBackground(1, 1, 1)
scene.add(actor.streamtube(streamlines, colors=window.colors.white, opacity=0.05))
scene.add(actor.streamtube(clusters.centroids, colors=colormap, linewidth=0.4))
window.record(scene=scene, out_path="fornix_centroids.png", size=(600, 600))
if interactive:
    window.show(scene)
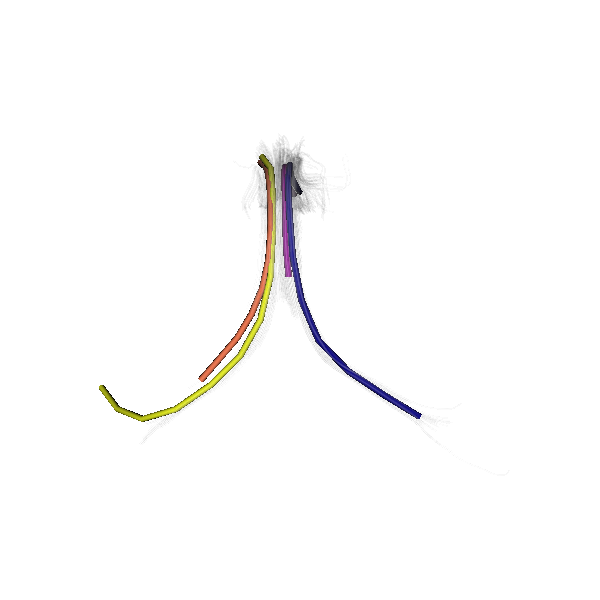
Showing the different QuickBundles centroids with random colors.
Show the labeled fornix (colors from centroids).
colormap_full = np.ones((len(streamlines), 3))
for cluster, color in zip(clusters, colormap):
    colormap_full[cluster.indices] = color

scene.clear()
scene.SetBackground(1, 1, 1)
scene.add(actor.streamtube(streamlines, colors=colormap_full))
window.record(scene=scene, out_path="fornix_clusters.png", size=(600, 600))
if interactive:
    window.show(scene)
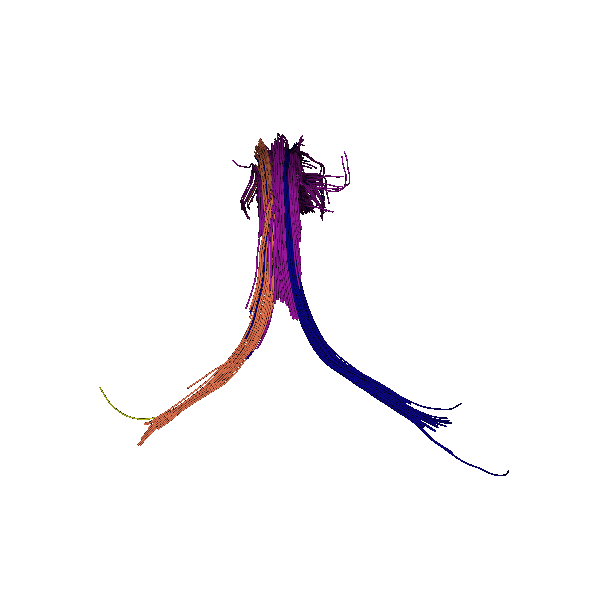
Showing the different clusters.
It is also possible to save the complete ClusterMap object with pickling.
save_pickle("QB.pkl", clusters)
Finally, here is a video of QuickBundles applied on a larger dataset.
References#
Total running time of the script: (0 minutes 0.211 seconds)