Note
Go to the end to download the full example code.
Calculation of Outliers with Cluster Confidence Index#
This is an outlier scoring method that compares the pathways of each streamline in a bundle (pairwise) and scores each streamline by how many other streamlines have similar pathways. The details can be found in [1].
import matplotlib.pyplot as plt

from dipy.core.gradients import gradient_table
from dipy.data import default_sphere, get_fnames
from dipy.direction import peaks_from_model
from dipy.io.gradients import read_bvals_bvecs
from dipy.io.image import load_nifti, load_nifti_data
from dipy.reconst.shm import CsaOdfModel
from dipy.tracking import utils
from dipy.tracking.stopping_criterion import ThresholdStoppingCriterion
from dipy.tracking.streamline import Streamlines, cluster_confidence
from dipy.tracking.tracker import eudx_tracking
from dipy.tracking.utils import length
from dipy.viz import actor, window
First, we need to generate some streamlines. For a more complete description of these steps, please refer to the CSA Probabilistic Tracking and the Visualization of ROI Surface Rendered with Streamlines Tutorials.
hardi_fname, hardi_bval_fname, hardi_bvec_fname = get_fnames(name="stanford_hardi")
label_fname = get_fnames(name="stanford_labels")

data, affine = load_nifti(hardi_fname)
labels = load_nifti_data(label_fname)
bvals, bvecs = read_bvals_bvecs(hardi_bval_fname, hardi_bvec_fname)
gtab = gradient_table(bvals, bvecs=bvecs)

white_matter = (labels == 1) | (labels == 2)
csa_model = CsaOdfModel(gtab, sh_order_max=6)
csa_peaks = peaks_from_model(
    csa_model,
    data,
    default_sphere,
    relative_peak_threshold=0.8,
    min_separation_angle=45,
    mask=white_matter,
)
stopping_criterion = ThresholdStoppingCriterion(csa_peaks.gfa, 0.25)
We will use a slice of the anatomically-based corpus callosum ROI as our seed mask to demonstrate the method.
# Make a corpus callosum seed mask for tracking
seed_mask = labels == 2
seeds = utils.seeds_from_mask(seed_mask, affine, density=[1, 1, 1])
# Make a streamline bundle model of the corpus callosum ROI connectivity
streamlines_generator = eudx_tracking(
    seeds,
    stopping_criterion,
    affine,
    pam=csa_peaks,
    random_seed=1,
    sphere=default_sphere,
    step_size=2,
)
streamlines = Streamlines(streamlines_generator)
We do not want our results inflated by short streamlines, so we remove streamlines shorter than 40mm prior to calculating the CCI.
Now we calculate the Cluster Confidence Index using the corpus callosum streamline bundle and visualize them.
cci = cluster_confidence(long_streamlines)

# Visualize the streamlines, colored by cci
scene = window.Scene()

hue = [0.5, 1]
saturation = [0.0, 1.0]

lut_cmap = actor.colormap_lookup_table(
    scale_range=(cci.min(), cci.max() / 4), hue_range=hue, saturation_range=saturation
)

bar3 = actor.scalar_bar(lookup_table=lut_cmap)
scene.add(bar3)

stream_actor = actor.line(
    long_streamlines, colors=cci, linewidth=0.1, lookup_colormap=lut_cmap
)
scene.add(stream_actor)
If you set interactive to True (below), the scene will pop up in an interactive window.
interactive = False
if interactive:
    window.show(scene)
window.record(scene=scene, out_path="cci_streamlines.png", size=(800, 800))
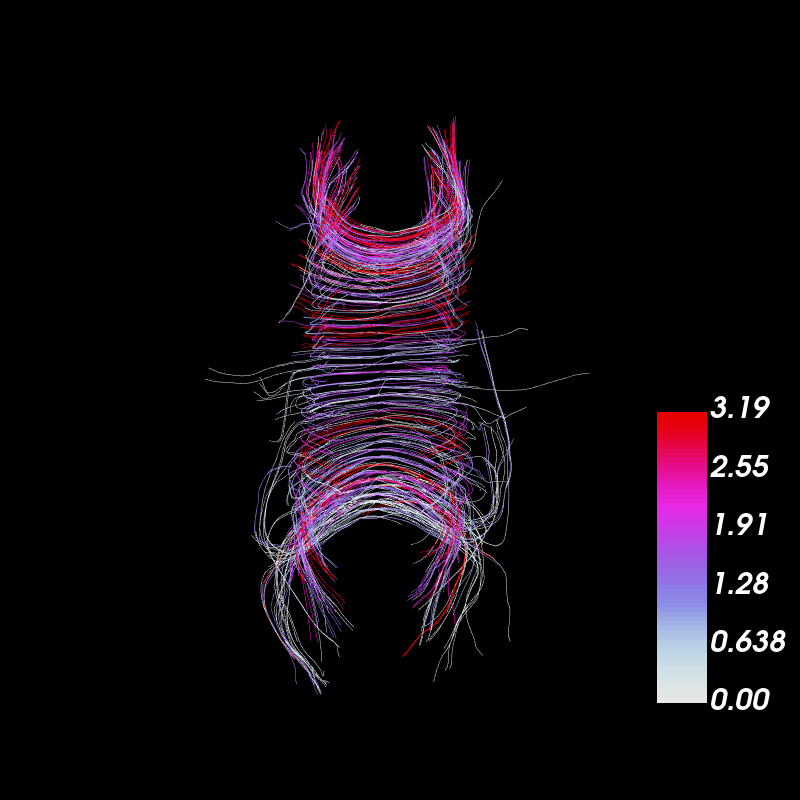
Cluster Confidence Index of corpus callosum dataset.
If you think of each streamline as a sample of a potential pathway through a complex landscape of white matter anatomy probed via water diffusion, intuitively we have more confidence that pathways represented by many samples (streamlines) reflect a more stable representation of the underlying phenomenon we are trying to model (anatomical landscape) than do lone samples.
The CCI provides a voting system where by each streamline (within a set tolerance) gets to vote on how much support it lends to. Outlier pathways score relatively low on CCI, since they do not have many streamlines voting for them. These outliers can be removed by thresholding on the CCI metric.
fig, ax = plt.subplots(1)
ax.hist(cci, bins=100, histtype="step")
ax.set_xlabel("CCI")
ax.set_ylabel("# streamlines")
fig.savefig("cci_histogram.png")
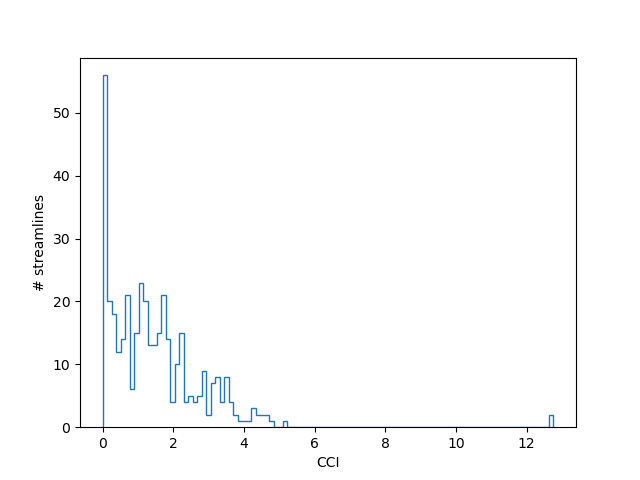
Histogram of Cluster Confidence Index values.
Now we threshold the CCI, defining outliers as streamlines that score below 1.
keep_streamlines = Streamlines()
for i, sl in enumerate(long_streamlines):
    if cci[i] >= 1:
        keep_streamlines.append(sl)

# Visualize the streamlines we kept
scene = window.Scene()

keep_streamlines_actor = actor.line(keep_streamlines, linewidth=0.1)

scene.add(keep_streamlines_actor)

interactive = False
if interactive:
    window.show(scene)
window.record(scene=scene, out_path="filtered_cci_streamlines.png", size=(800, 800))
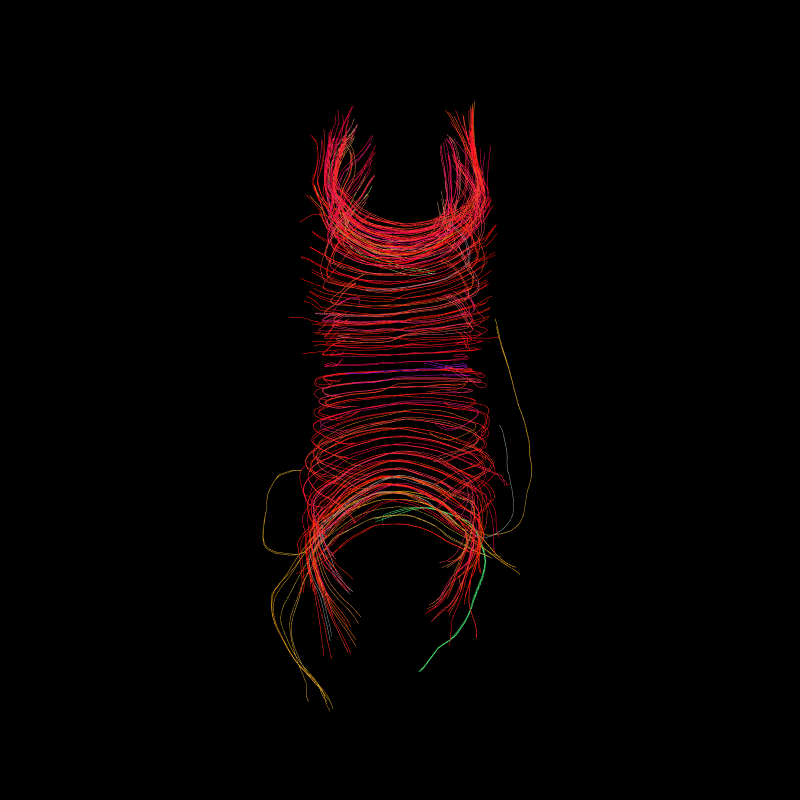
Outliers, defined as streamlines scoring CCI < 1, were excluded.
References#
Total running time of the script: (0 minutes 9.400 seconds)